mel_viz turns any WAV file into a browser-based radial animation driven by mel-spectrum analysis. Concentric rings pulse, wobble, and glow in response to the audio — bass hits zoom the whole canvas.
Visualize your own audio
Follow these steps to create a visualization from any WAV file.
1. Build mel_viz
From the repository root:
This compiles tools/mel_viz/mel_viz (requires FFTW3 and libsndfile).
2. Run mel_viz on your WAV file
Replace your_song.wav with the path to your audio file. The tool reads the WAV, computes per-frame mel energies, and writes a self-contained visualization folder to the output directory.
Common options:
| Flag | Default | What it does |
|---|---|---|
| -o <dir> | mel_viz_out/ | Output directory |
| --mels <n> | 24 | Number of mel bands |
| --fft-size <n> | 2048 | FFT window size |
| --fps <n> | 30 | Frames per second |
| --min-freq <hz> | 40 | Low frequency bound |
| --max-freq <hz> | 16000 | High frequency bound |
3. Open in a browser
The output folder needs to be served over HTTP (browsers block local file:// audio playback). The easiest way:
Then open http://localhost:8000 in your browser and press play.
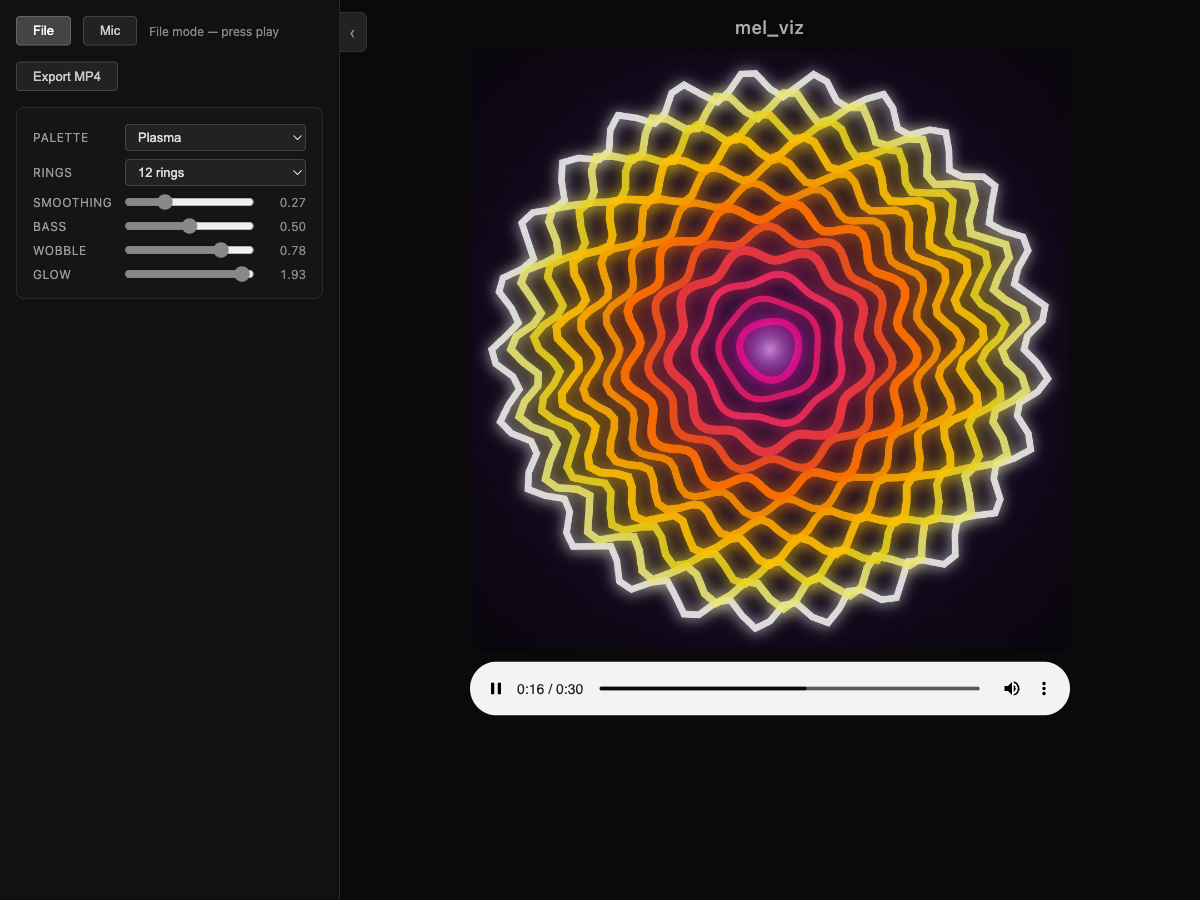
4. Tweak the visual controls
The side panel on the left has real-time knobs — no recomputation needed:
- Palette — Plasma, Ocean, Fire, or Neon color themes
- Rings — 8, 12, or 24 concentric ring groups
- Smoothing — Temporal smoothing from snappy to flowing
- Bass — How much kick/bass hits zoom the entire canvas
- Wobble — Ring edge deformation amount
- Glow — Neon bloom intensity around each ring
Experiment with different palettes and cranking up the glow and wobble for a more psychedelic look, or dial them down for a clean, minimal animation.
5. Export as video
Want to share your visualization? Click Export MP4 in the side panel. The browser renders every frame offline and muxes it into an MP4 file (Chrome or Edge required — uses the WebCodecs API).
Live mic mode
The web renderer also works standalone without the C program — it captures microphone audio and visualizes it in real time.
Click Mic, grant microphone access, and the visualization responds to whatever you play or say.
Architecture
The C program reads audio via libsndfile, computes per-frame mel energies using MD_mel_energies(), and writes the data as a JavaScript file. The browser renders concentric rings whose size, color, glow, and wobble are driven by the mel band energies.
For the full list of CLI flags, see the mel_viz README.