This tutorial walks through examples/phase_spectrum.c, which generates a three-component test signal, computes its phase spectrum with MD_phase_spectrum(), and visualises both the magnitude and phase with an interactive Plotly chart.
If you haven't read Computing the Magnitude Spectrum yet, start there – it covers the DFT fundamentals this tutorial builds on.
What is the phase spectrum?
Every DFT coefficient \(X(k)\) is a complex number with a magnitude and an angle. The magnitude spectrum \(|X(k)|\) tells you how much energy is at frequency \(k\). The phase spectrum \(\phi(k)\) tells you the timing of that frequency component:
\[\phi(k) = \arg X(k) = \mathrm{atan2}\!\bigl(\mathrm{Im}\, X(k),\,\mathrm{Re}\, X(k)\bigr) \qquad \phi(k) \in [-\pi,\, \pi] \]
Reading the formula in C:
Intuitive meaning
| Signal | Phase at its bin |
|---|---|
| \(\cos(2\pi k_0 n / N)\) | \(\phi(k_0) = 0\) |
| \(\sin(2\pi k_0 n / N)\) | \(\phi(k_0) = -\pi/2\) |
| \(\cos(2\pi k_0 n / N + \varphi)\) | \(\phi(k_0) = \varphi\) |
| Impulse delayed by \(d\) samples | \(\phi(k) = -2\pi k d / N\) (linear) |
A time-delayed signal is the most important case: the DFT shift theorem says delaying a signal by \(d\) samples adds a linear phase ramp of slope \(-2\pi d / N\) radians per bin. This is the basis of the GCC-PHAT delay estimator (see MD_get_delay()).
When to trust the phase
Phase is only meaningful at bins where the magnitude is significant. At bins dominated by noise or leakage, \(\phi(k)\) is numerically unreliable – always examine MD_magnitude_spectrum() alongside the phase spectrum.
Step 1: Generate a test signal
The test signal has three components at exact integer-bin frequencies (N = 1024, sample rate = 1024 Hz, so bin \(k\) corresponds to exactly \(k\) Hz). With exact bins there is no spectral leakage, so no windowing is needed and the phase values are bit-exact.
The three components and their expected phase values:
| Component | Bin | Expected \(\phi\) |
|---|---|---|
| cos(50 Hz) | 50 | 0 |
| sin(100 Hz) | 100 | \(-\pi/2\) |
| cos(200 Hz, \f$\pi/4\f$ offset) | 200 | \(\pi/4\) |
Step 2: Compute the phase spectrum
MD_phase_spectrum() reuses the same cached FFT plan as MD_magnitude_spectrum() and MD_power_spectral_density(). Calling both in sequence costs only one plan lookup:
The output phase[k] is in radians, range \([-\pi, \pi]\). The magnitude output mag[k] lets you distinguish signal bins from noise bins when interpreting the phase.
Results
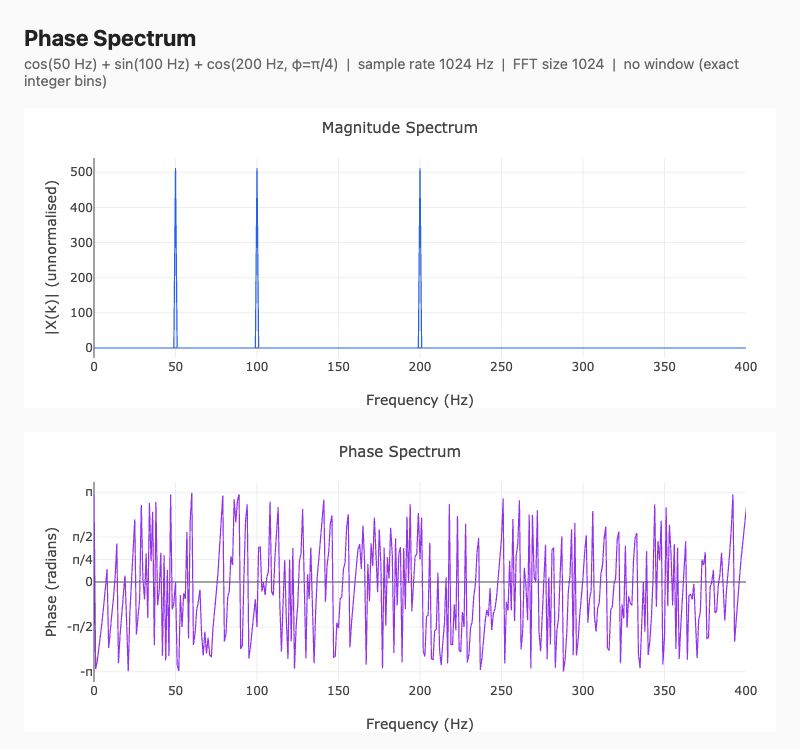
The magnitude plot (top) confirms that energy is concentrated at bins 50, 100, and 200. The phase plot (bottom) shows:
- Bin 50: \(\phi \approx 0\) (pure cosine)
- Bin 100: \(\phi \approx -\pi/2\) (pure sine)
- Bin 200: \(\phi \approx \pi/4\) (phase-shifted cosine)
At all other bins the phase is numerically arbitrary (magnitude is zero).
Key takeaways
- \(\phi(k) = \arg X(k)\) is computed by carg(), which calls atan2(Im, Re) and returns values in \([-\pi, \pi]\).
- Phase is scale-invariant: multiplying a signal by a positive constant does not change its phase.
- No windowing is needed when all frequency components land on exact integer bins. Windowing smears phase and should be omitted for clean phase measurements.
- Always look at the magnitude spectrum alongside the phase spectrum. Phase at low-magnitude bins is meaningless noise.
- A linear phase ramp ( \(\phi(k) = -2\pi k d/N\)) indicates a time delay of \(d\) samples – the foundation of GCC-PHAT delay estimation.
Connection to phase vocoder
The phase vocoder uses phase differences between consecutive STFT frames to track the instantaneous frequency of each bin, enabling high-quality time-stretching and pitch-shifting of audio. MD_phase_spectrum() provides the per-frame phase needed as input to such an algorithm.
Further reading
- Phase (waves) – Wikipedia
- DFT shift theorem – Wikipedia
- Phase vocoder – Wikipedia
- Julius O. Smith, Spectral Audio Signal Processing – free online textbook
- Previous tutorial: Computing the Power Spectral Density
- Next: Spectrogram and the STFT
API reference
- MD_phase_spectrum() – compute the one-sided phase spectrum
- MD_magnitude_spectrum() – compute the magnitude spectrum
- MD_power_spectral_density() – compute the PSD (periodogram)
- MD_shutdown() – free cached FFTW plans