Computing the Magnitude Spectrum
The magnitude spectrum tells you the amplitude of each sinusoidal component present in a signal.
Workflow
Generate (or load) a signal.
Apply a window function to reduce spectral leakage.
Compute the magnitude spectrum via
magnitude_spectrum().Normalise if needed.
Example
import pyminidsp as md
import numpy as np

sr = 44100.0
N = 1024

# Build a test signal: 440 Hz + 1000 Hz + 2500 Hz + DC offset
t = np.arange(N) / sr
signal = (0.1
          + 1.0 * np.sin(2 * np.pi * 440.0 * t)
          + 0.5 * np.sin(2 * np.pi * 1000.0 * t)
          + 0.3 * np.sin(2 * np.pi * 2500.0 * t))

mag = md.magnitude_spectrum(signal)

# mag has N//2 + 1 = 513 bins
# bin k → frequency = k * sr / N
Normalisation
The raw output is not normalised by N. Three steps to get single-sided amplitudes:
Divide all bins by N.
Double interior bins (k = 1 to N/2 − 1) to account for folded negative frequencies.
Leave DC (k = 0) and Nyquist (k = N/2) unchanged.
amp = mag / N
amp[1:-1] *= 2  # double interior bins
Visualisation
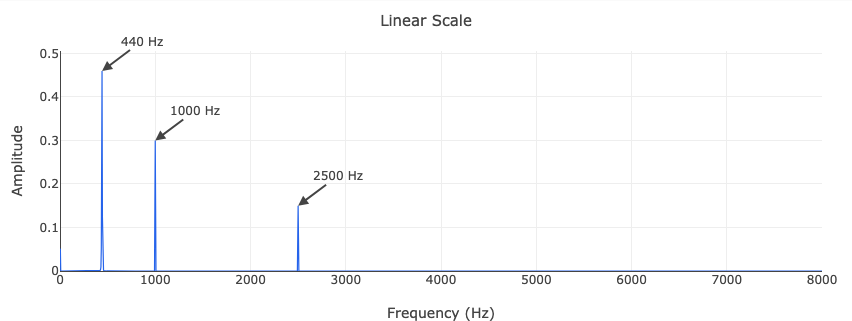
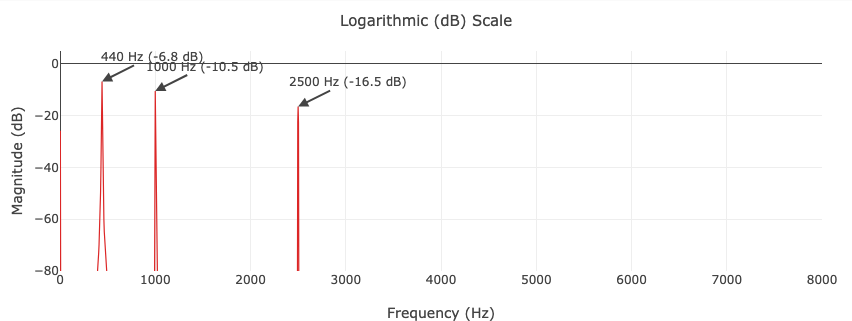
The linear plot shows distinct peaks at the input frequencies. The logarithmic (dB) scale reveals the Hanning window’s sidelobes and low-level details that are invisible on a linear axis.
# Convert to dB (for plotting)
mag_db = 20 * np.log10(amp + 1e-12)

md.shutdown()