Phase Spectrum
The phase spectrum describes the timing of frequency components. Each DFT coefficient is a complex number; while magnitude reveals energy distribution, phase reveals the angle or shift of that frequency component:
\[\phi(k) = \arg X(k) = \text{atan2}(\text{Im}\,X(k),\;\text{Re}\,X(k))\]
Values span \([-\pi, \pi]\).
Key intuitions
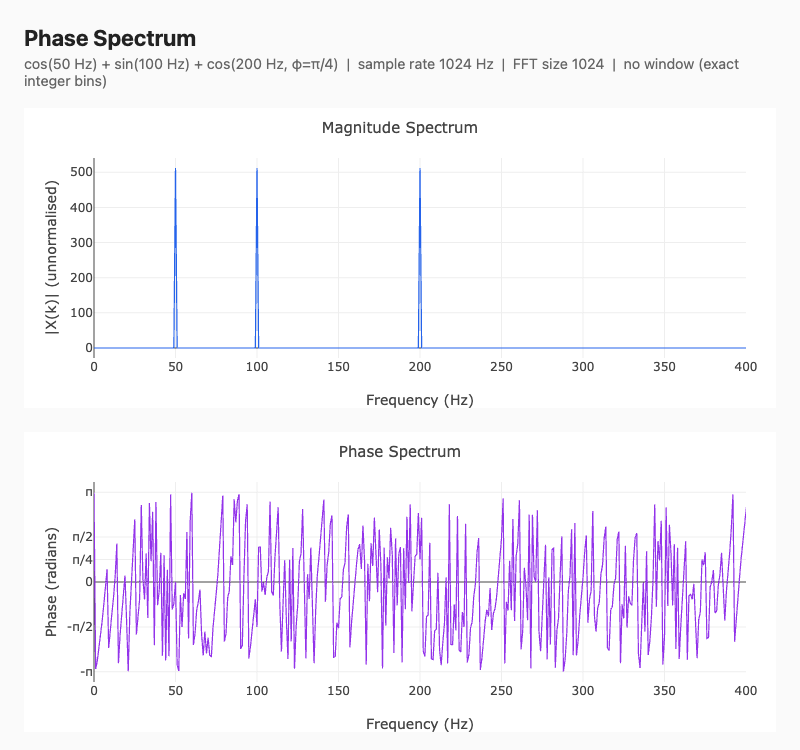
A cosine at an integer bin produces \(\phi \approx 0\).
A sine at the same bin produces \(\phi \approx -\pi/2\).
A time-delayed signal exhibits linear phase: \(\phi(k) = -2\pi k d / N\), a principle underlying delay estimation (GCC-PHAT).
Example
import pyminidsp as md
import numpy as np

N = 1024
sr = 44100.0
t = np.arange(N) / sr

# Three tones with known phases
signal = (1.0 * np.cos(2 * np.pi * 440.0 * t)     # phase ≈ 0
        + 0.5 * np.sin(2 * np.pi * 1000.0 * t))    # phase ≈ -π/2

phase = md.phase_spectrum(signal)
# phase has N//2 + 1 = 513 bins, values in [-π, π]
Important
Phase is only meaningful at bins where the magnitude is significant.
Always examine magnitude_spectrum() alongside the
phase to identify significant bins.
Visualisation
md.shutdown()