Power Spectral Density
The Power Spectral Density (PSD) measures how a signal’s power is distributed across frequencies. While the magnitude spectrum tells you the amplitude at each frequency, the PSD tells you the power — useful for noise analysis, SNR estimation, and comparing signals of different lengths.
Formula
The periodogram estimator:
\[\text{PSD}[k] = \frac{|X(k)|^2}{N}\]
Relationship to the magnitude spectrum:
PSD[k] = magnitude[k]**2 / N
dB conversion: use 10 * log10() for power (not 20 * log10()
as with amplitude), because power scales with amplitude squared:
10 * log10(A²) = 20 * log10(A).
Example
import pyminidsp as md
import numpy as np

sr = 44100.0
N = 1024

# Multi-tone test signal
t = np.arange(N) / sr
signal = (0.1
          + 1.0 * np.sin(2 * np.pi * 440.0 * t)
          + 0.5 * np.sin(2 * np.pi * 1000.0 * t)
          + 0.3 * np.sin(2 * np.pi * 2500.0 * t))

psd = md.power_spectral_density(signal)
Parseval’s theorem
Total time-domain energy equals frequency-domain energy (validation):
time_energy = np.sum(signal ** 2)
freq_energy = psd[0] + 2 * np.sum(psd[1:-1]) + psd[-1]
np.testing.assert_allclose(time_energy, freq_energy, rtol=1e-10)
Visualisation
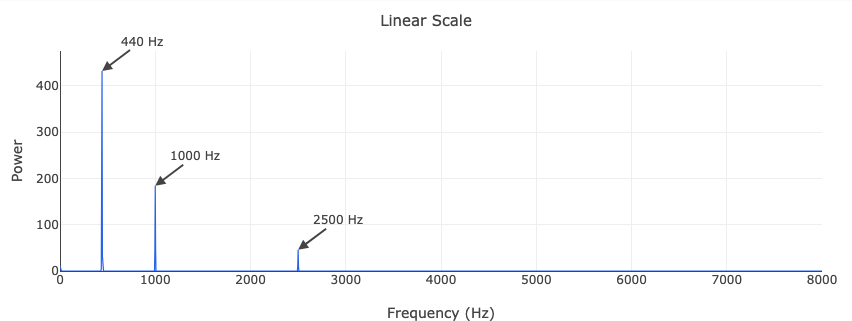
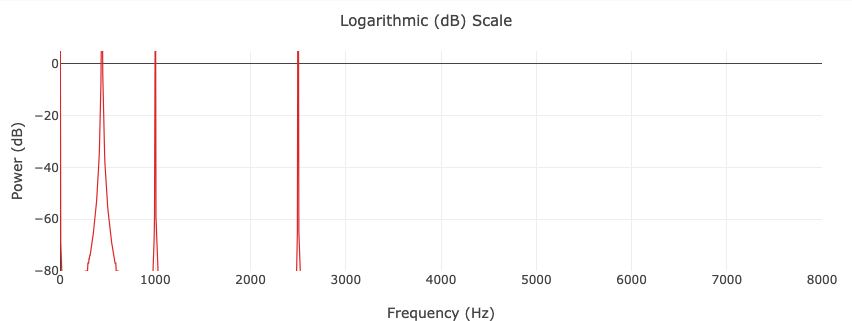
psd_db = 10 * np.log10(psd + 1e-12)

md.shutdown()